Using cceHub components to build simple data exploration tools
Category
Published on
Abstract
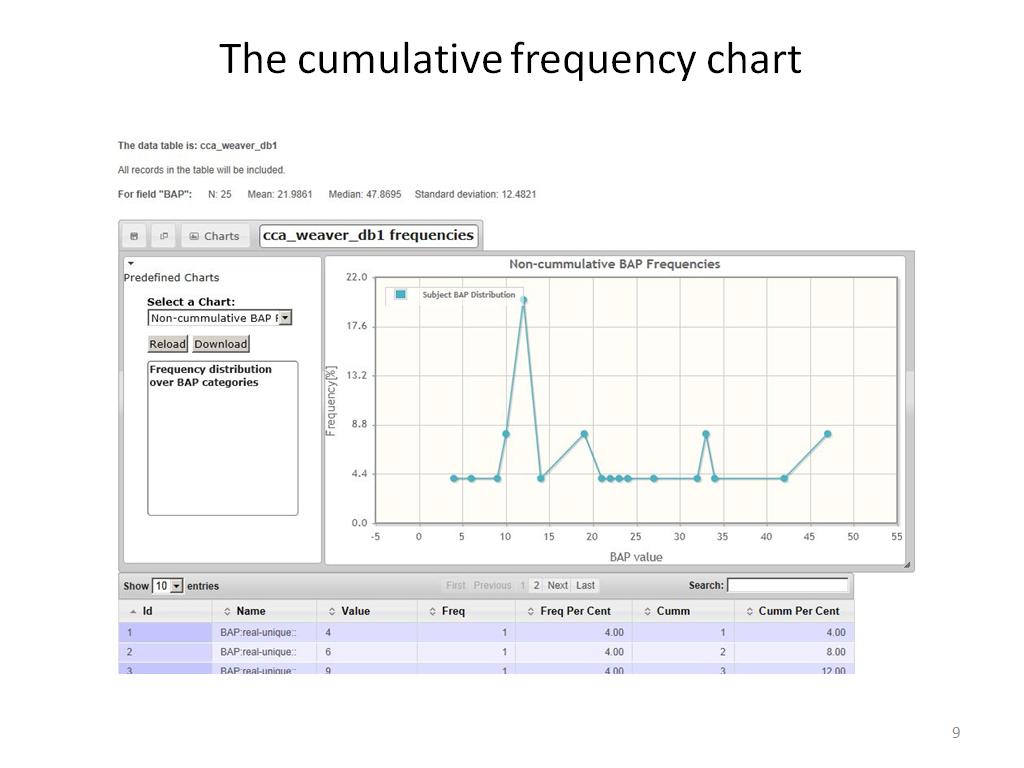
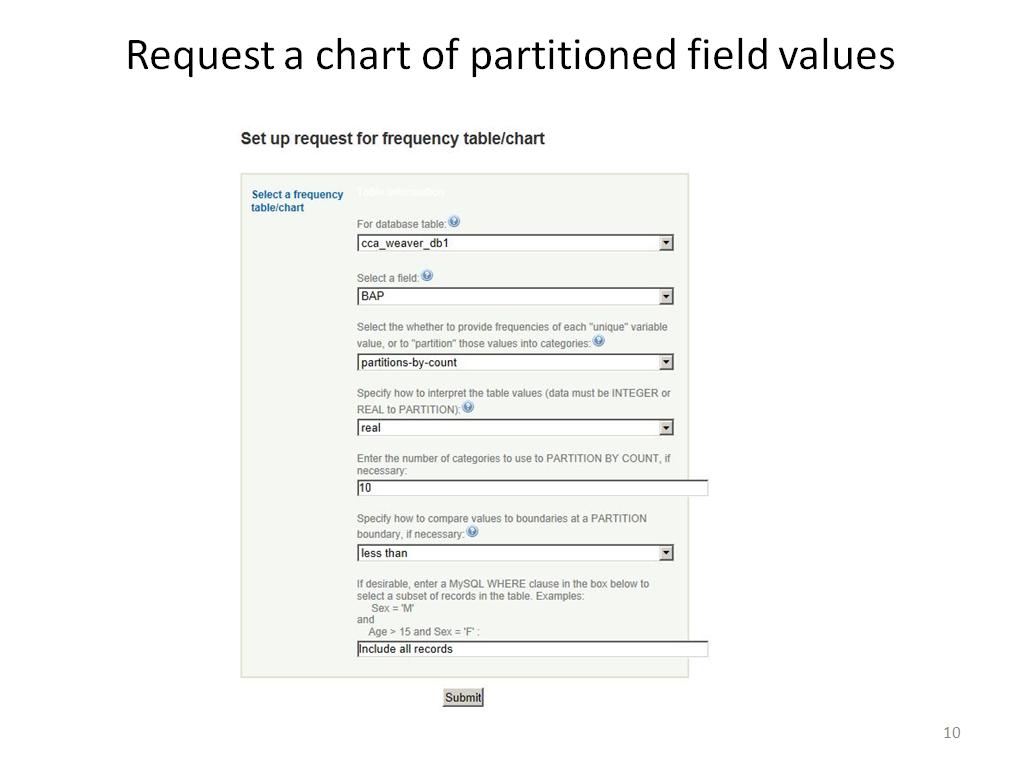
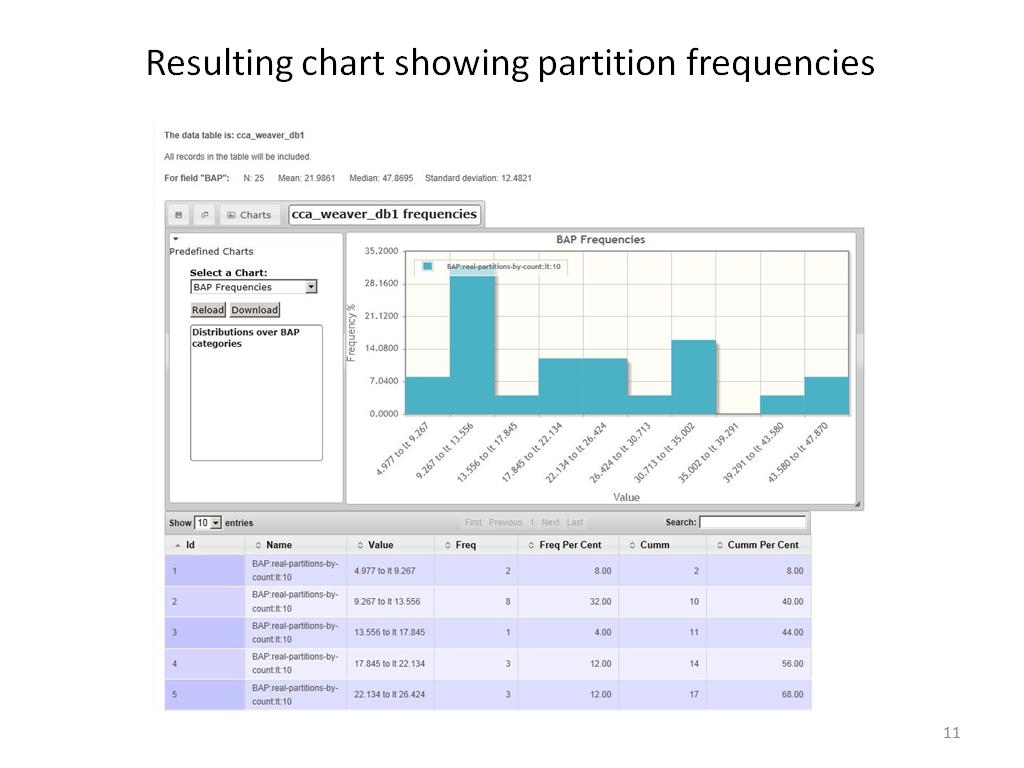
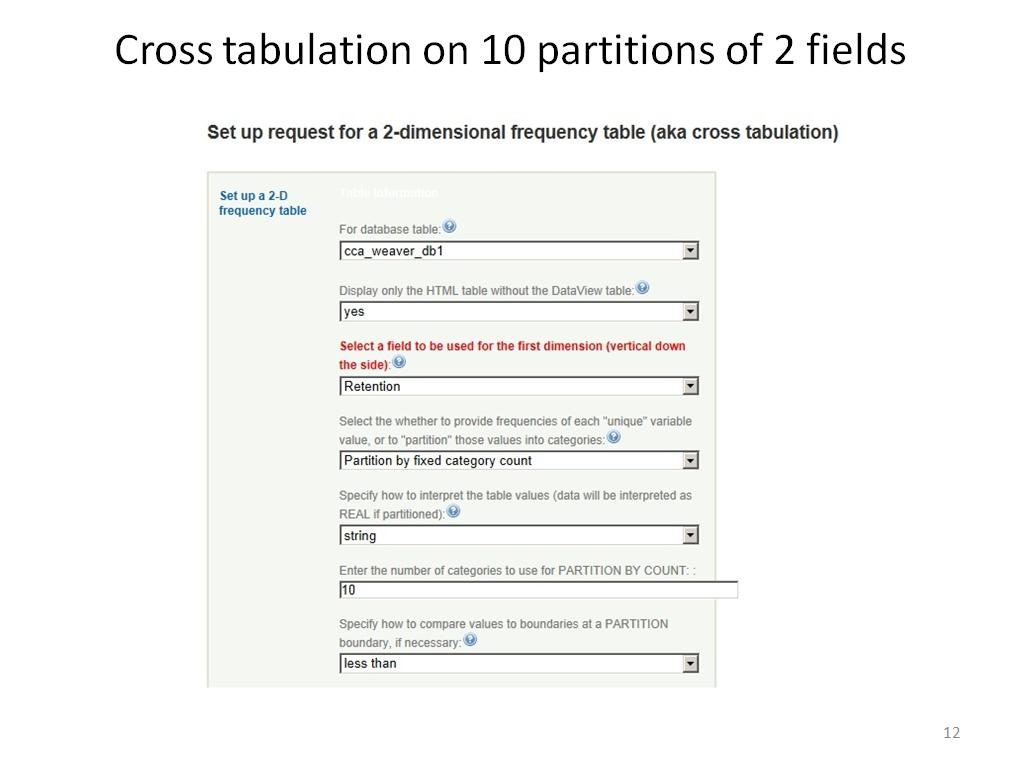
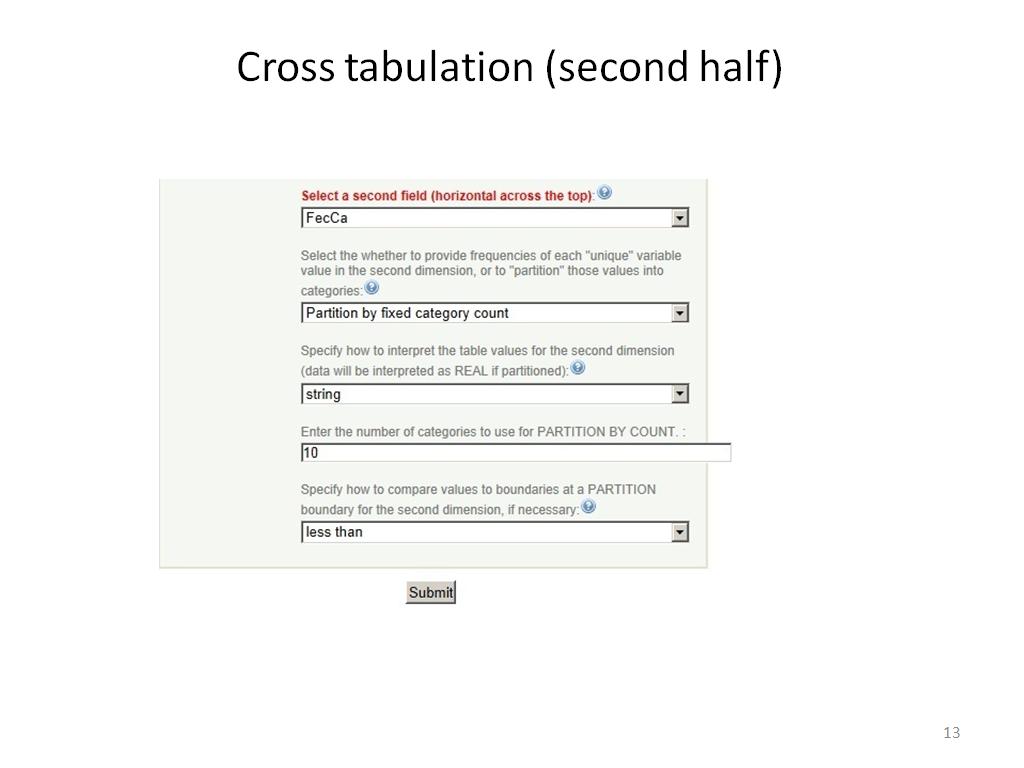
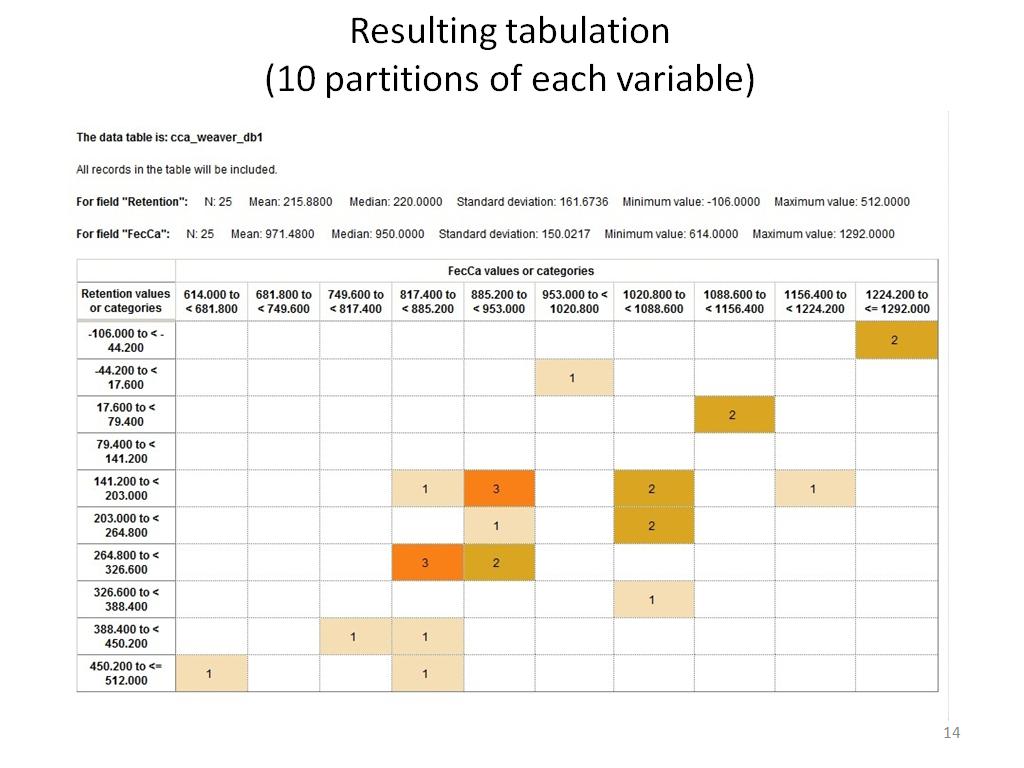
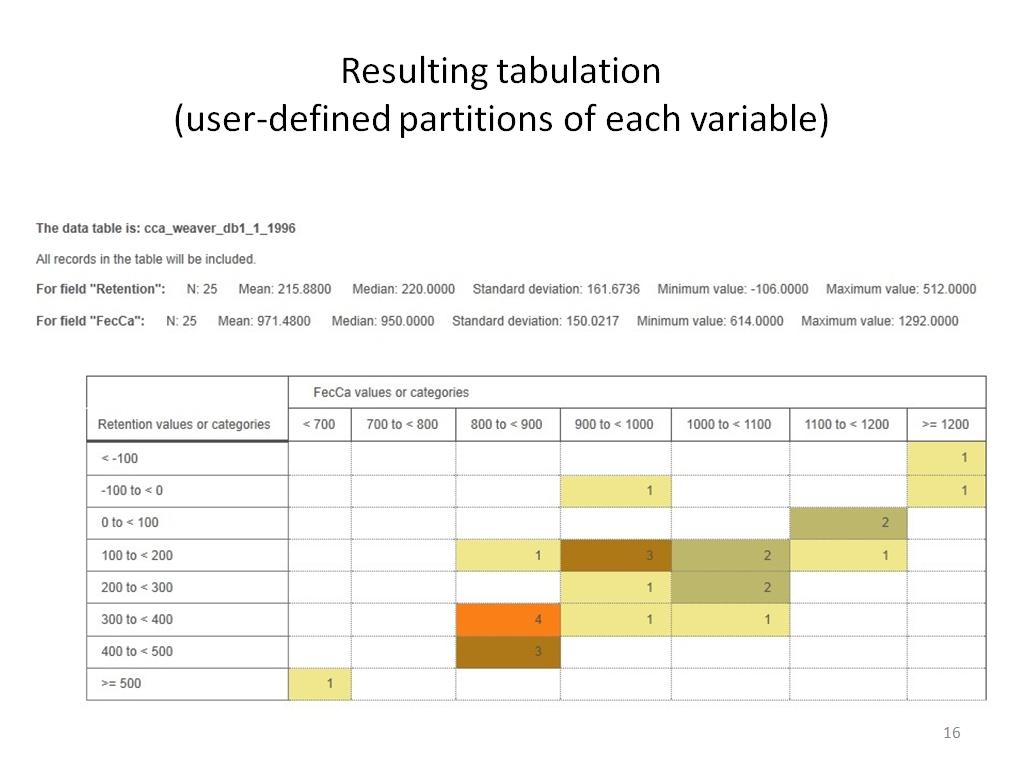
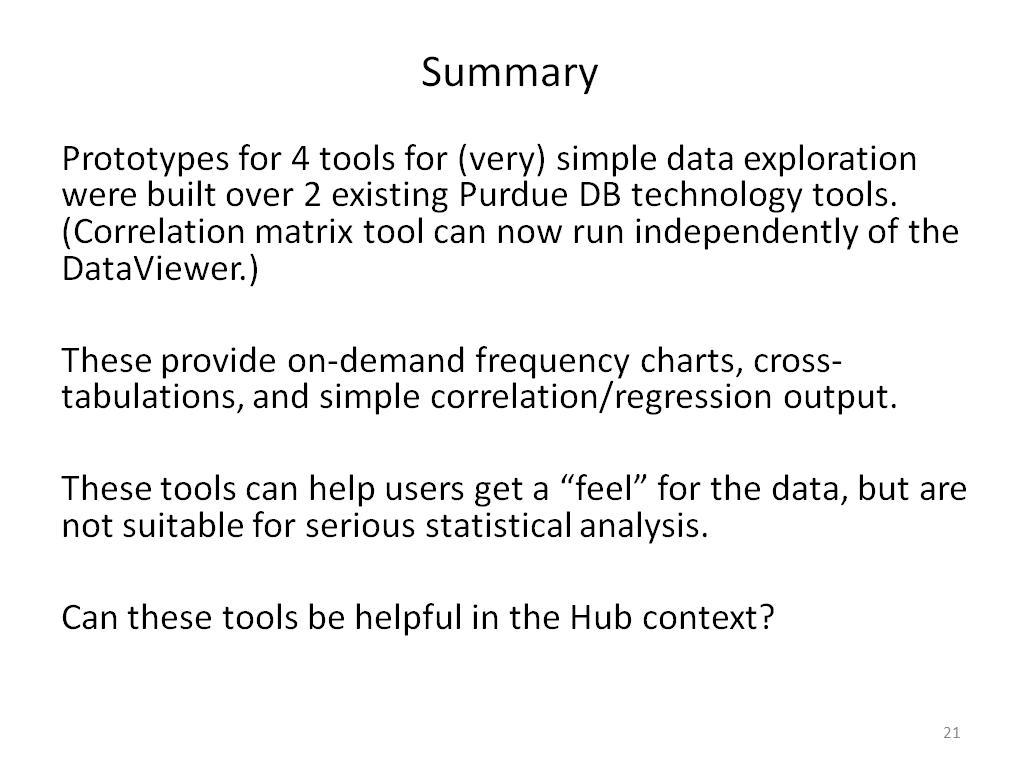
Several components developed as part of the cceHUB database project (namely com_dataview and com_form) were used to PROTOTYPE a new component supporting basic data exploration functions: the creation and display of frequency charts/tables, cross-tabulations, simple regressions, and correlation matrices.
These functions access individual tables already uploaded to databases accessible from the Hub; there is no provision at this time for uploading data that can then be explored, although tools for doing so have also been built using com_form, and could in principle serve that function.
This presentation would hope to identify interest among conference attendees to justify further development of the PROTOTYPE, since this software is not ready for deployment at this time.
For more information, including screen shots, see: http://mypage.iu.edu/~dgrobe/dataexplore/
Bio
Michael works as a Principal Systems Analyst in the Advanced Biomedical IT Core within Indiana University's Pervasive Technology Institute. He has a background and considerable experience in Web development, the construction and management of computer networks, and High Performance Computing. He came to the Pervasive Technology Institute to work on the Centralized Life Sciences Database, a large collection of genomics data, and has worked most recently on a variety of projects related to the Semantic Web and Indiana's CTSI Hub, including installation of the Purdue Database tools, definition of prototype tools for performing simple analyses (frequencies, cross-tabulations, correlation matrices) of data in DB tables, the manipulation of data about science researchers organized by the Vivo Consortium, software for searching the local Clinical Trials database, and is currently exploring the REDCap plugin facility.
Cite this work
-
 1. Using the Purdue DB Technology…
0
00:00/00:00
 -
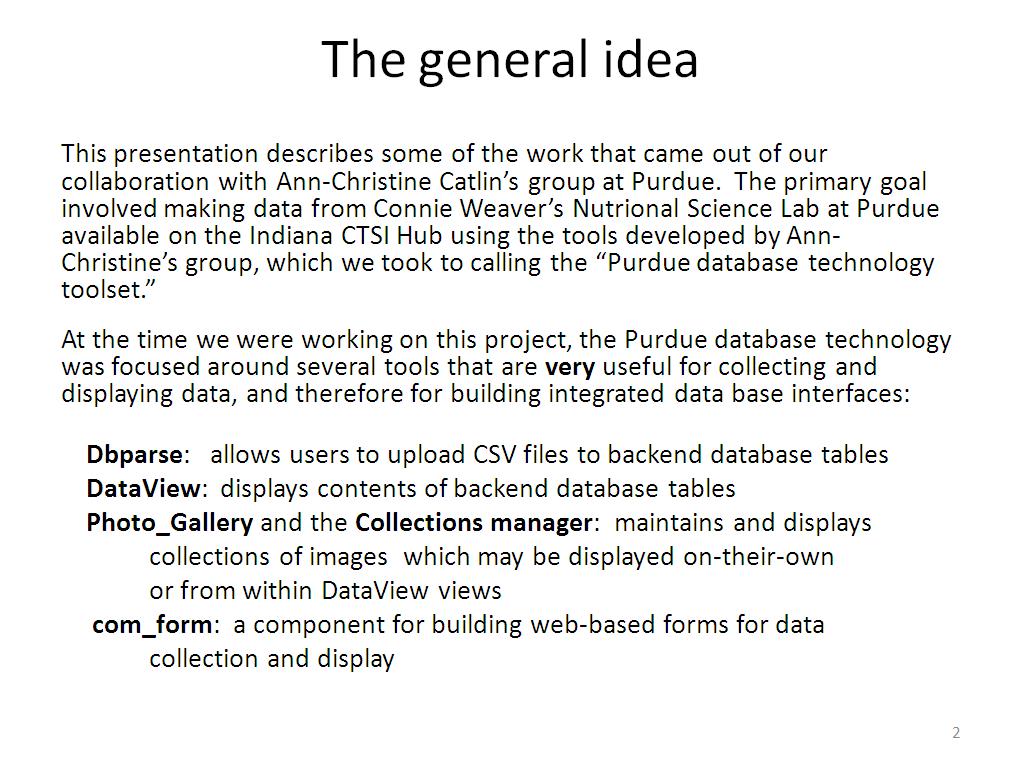 2. The general idea
79.87987987987988
00:00/00:00
 -
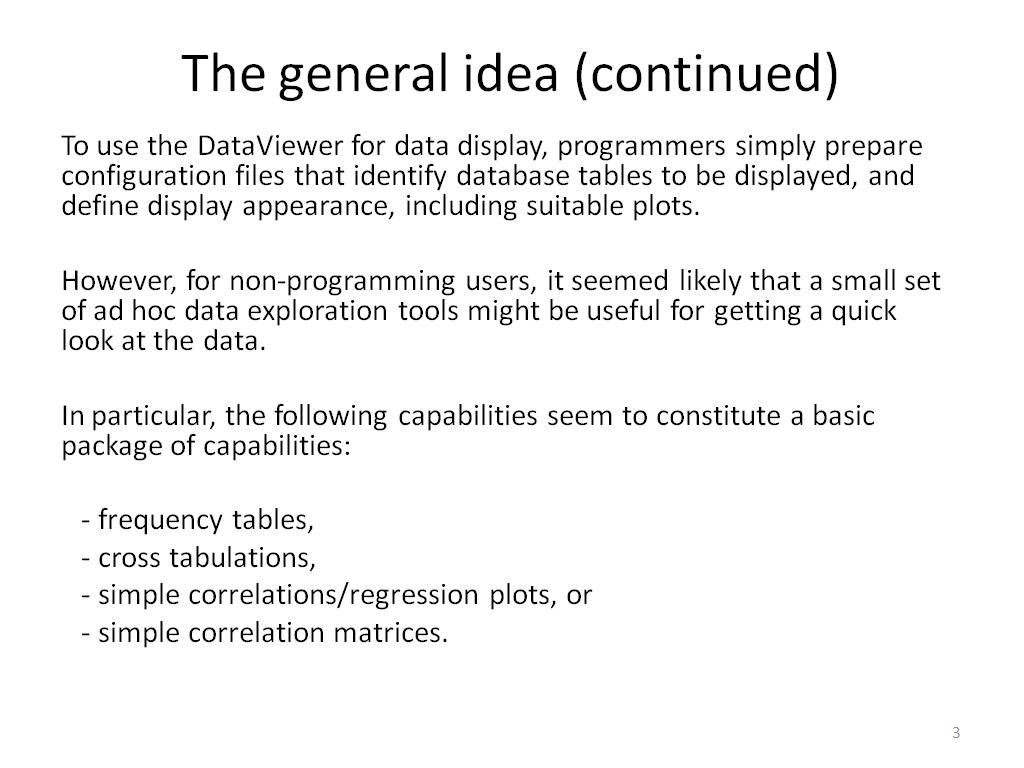 3. The general idea (continued)
248.9155822489156
00:00/00:00
 -
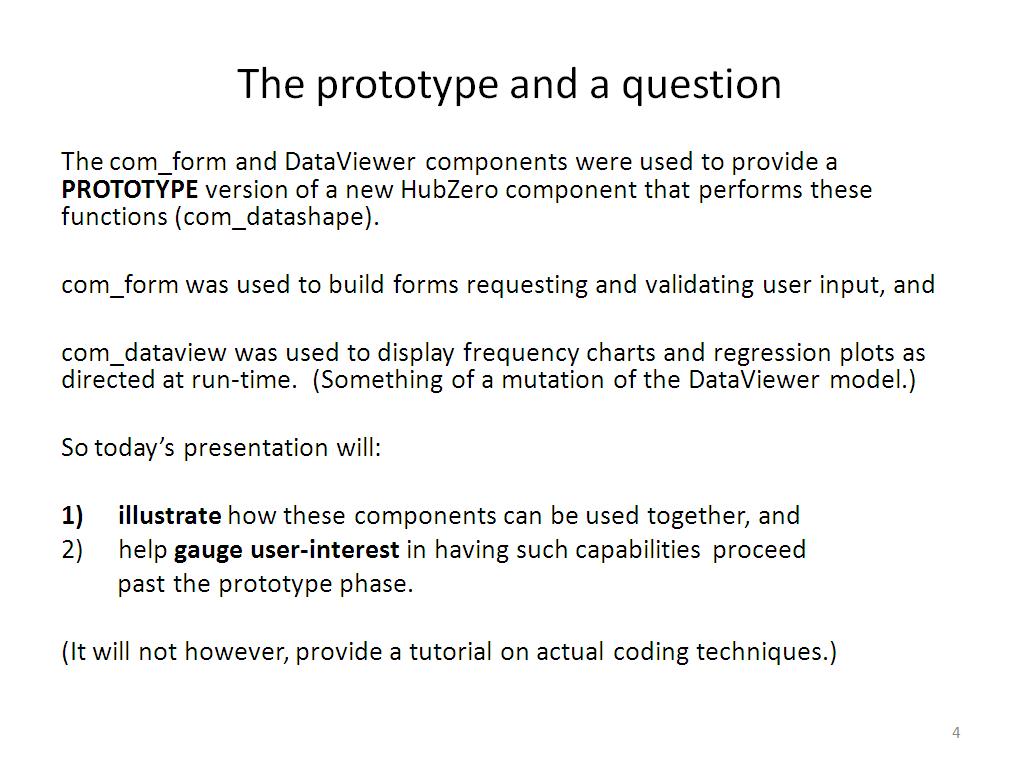 4. The prototype and a question
330.03003003003005
00:00/00:00
 -
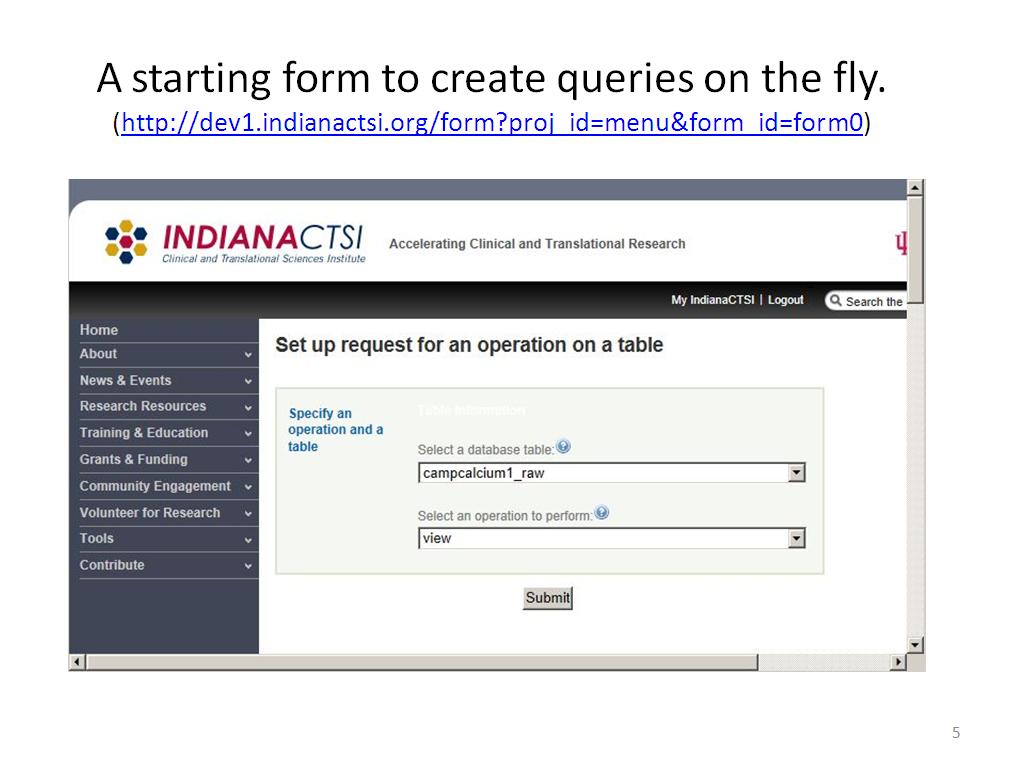 5. A starting form to create quer…
398.09809809809809
00:00/00:00
 -
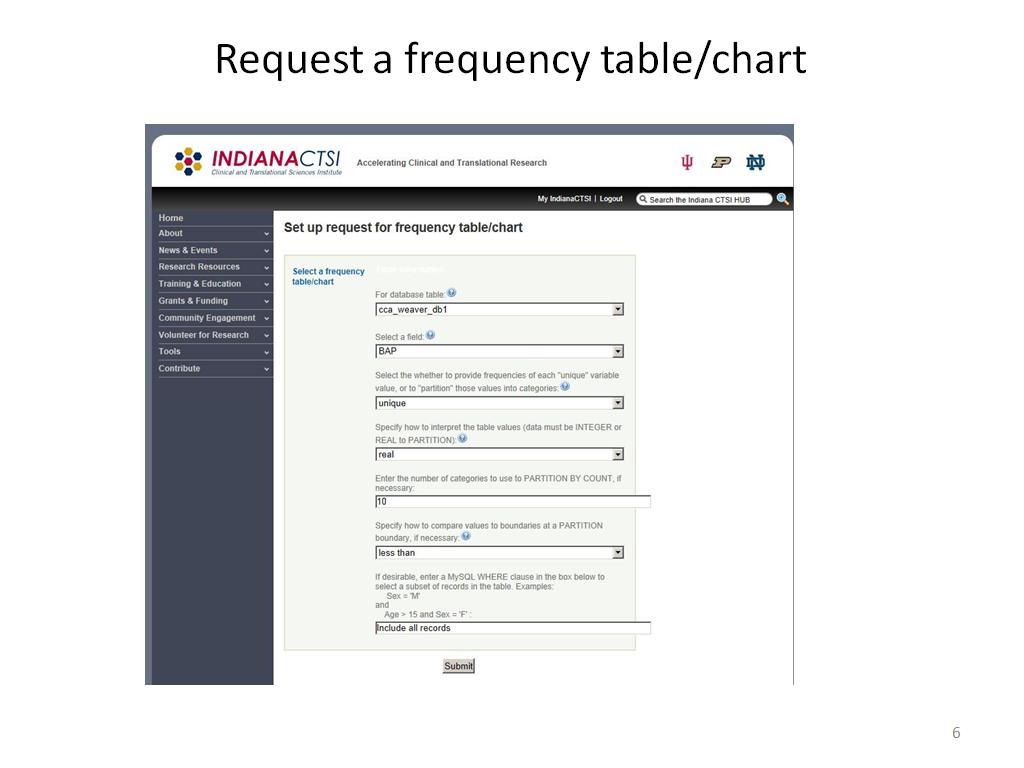 6. Request a frequency table/char…
435.6022689356023
00:00/00:00
 -
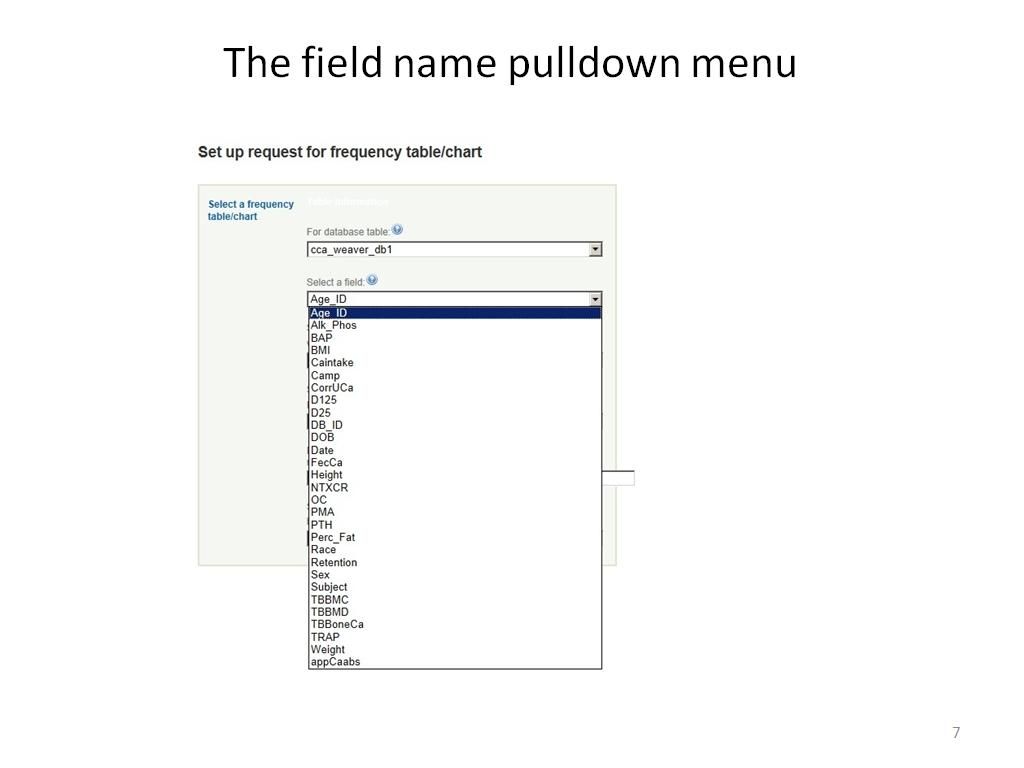 7. The field name pulldown menu
444.21087754421092
00:00/00:00
 -
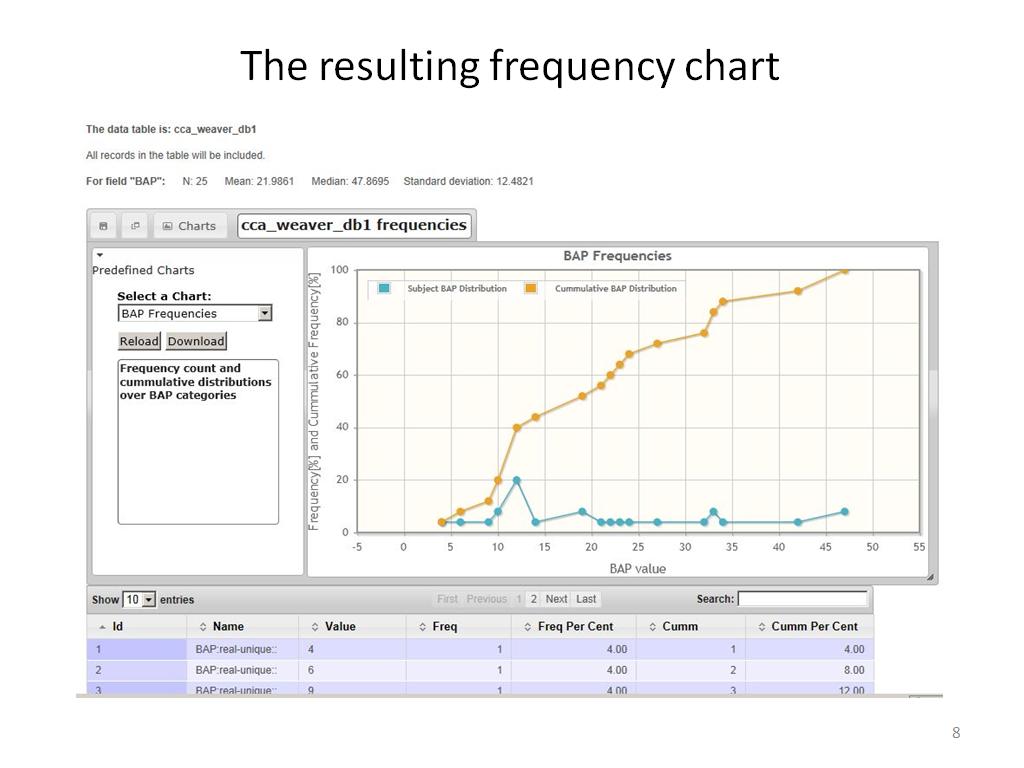 8. The resulting frequency chart
468.93560226893561
00:00/00:00
 -
 9. The cumulative frequency chart
490.55722389055722
00:00/00:00
 -
 10. Request a chart of partitioned…
501.40140140140142
00:00/00:00
 -
 11. Resulting chart showing partit…
519.35268601935275
00:00/00:00
 -
 12. Cross tabulation on 10 partiti…
524.52452452452451
00:00/00:00
 -
 13. Cross tabulation (second half)
562.06206206206207
00:00/00:00
 -
 14. Resulting tabulation (10 parti…
572.57257257257254
00:00/00:00
 -
 15. User specified partitions
585.48548548548547
00:00/00:00
 -
 16. Resulting tabulation (user-def…
592.0587253920587
00:00/00:00
 -
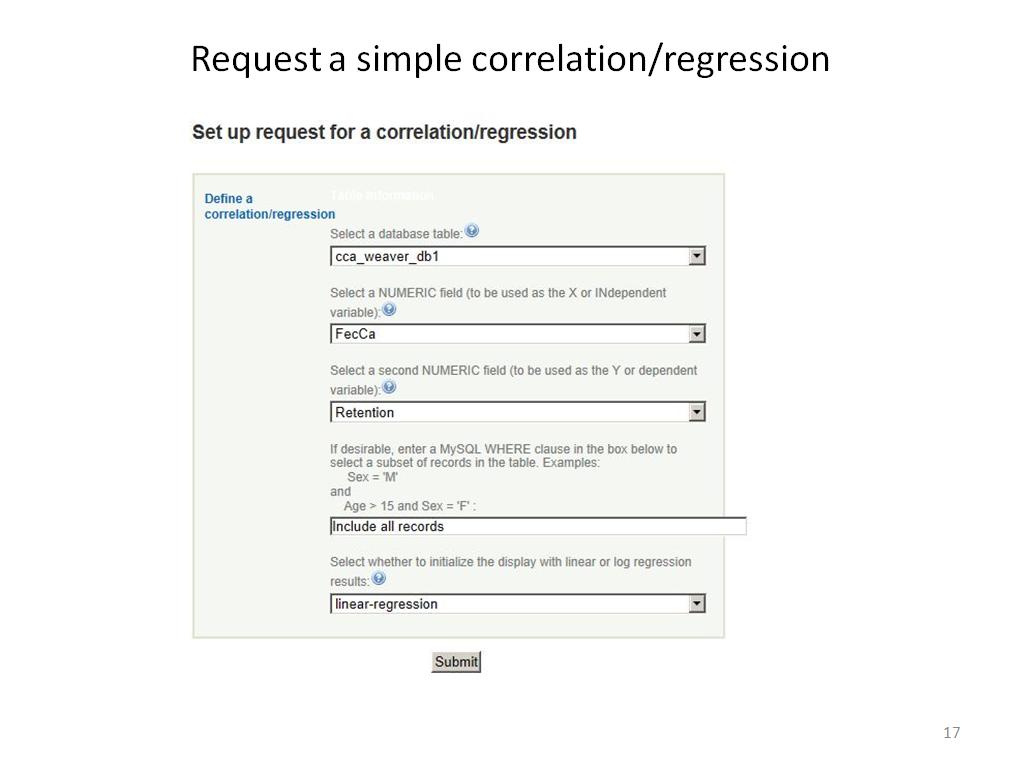 17. Request a simple correlation/r…
608.04137470804142
00:00/00:00
 -
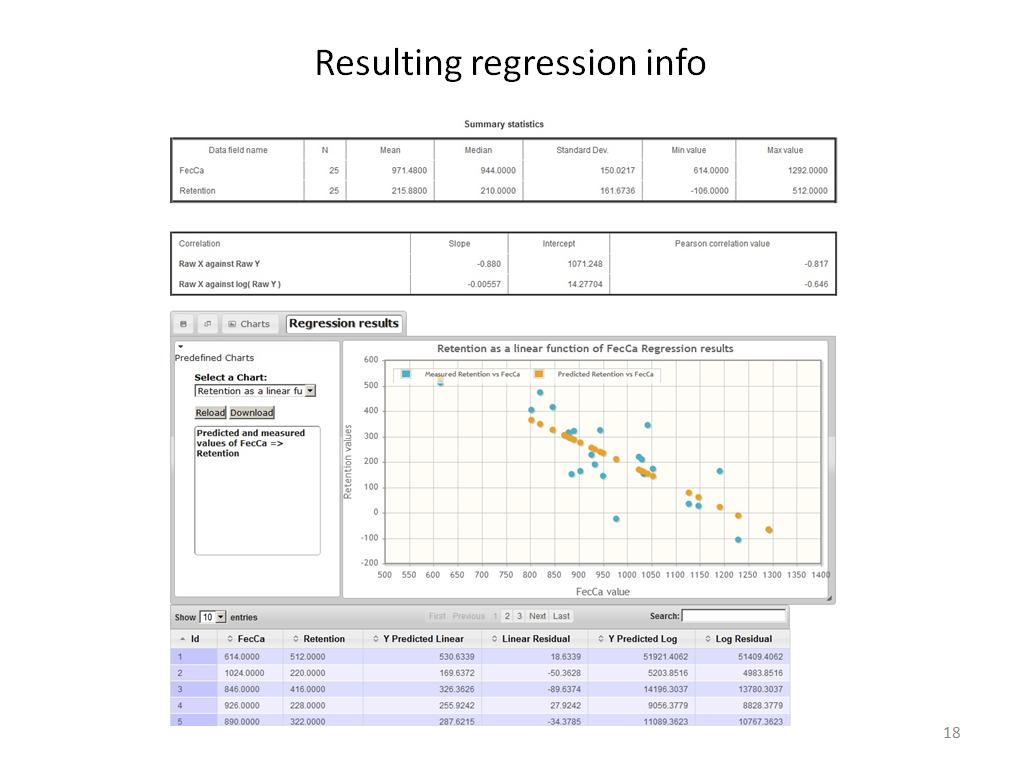 18. Resulting regression info
618.651985318652
00:00/00:00
 -
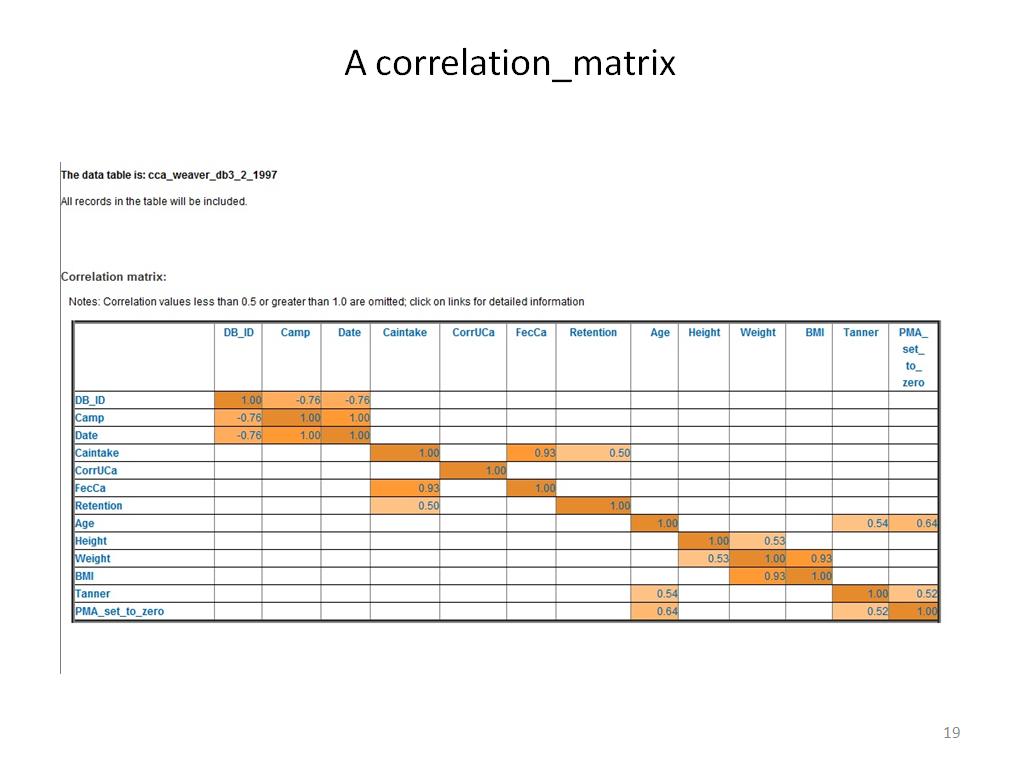 19. A correlation_matrix
643.97731064397738
00:00/00:00
 -
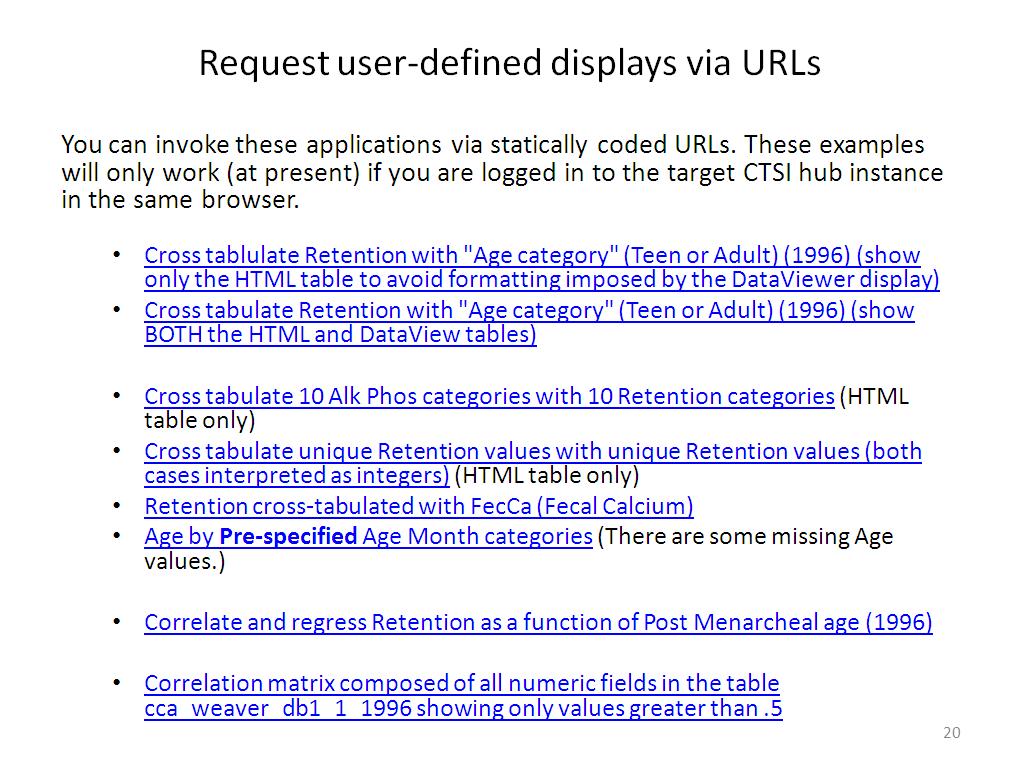 20. Request user-defined displays …
665.331998665332
00:00/00:00
 -
 21. Summary
672.67267267267266
00:00/00:00
 -
 22. Additional information
688.15482148815488
00:00/00:00